Sudden High CPU Utilization and Query Performance Decrease | When Query Plans Go Bad
Each morning when I get into the office, I check performance graphs in SolarWinds Database Performance Analyzer (DPA - formerly Confio Ignite). Monday mornings are usually the most important, because I run full system maintenance on a specific monitored database on Sunday. Monday is the first day of heavy utilization by users since the completion of that maintenance. The reason that maintenance is important is because updating statistics will often cause SQL Server to generate new execution plans. Sometimes the new plan is worse than the old plan and you see changes in system performance.
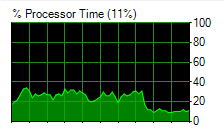
The great thing about SolarWinds DPA is that I have a graphical representation of all of my data and I can drill down into timeframes. I can also look backward in time to compare system performance. Since I look at the graphs so frequently, I am familiar with which queries generate the most wait time, and what I should expect from my CPU utilization. One morning the graphs showed an extreme spike in wait time for a single stored procedure called GetIDXIntegratedTaskList. I also quickly realized that the CPU on the database was running at double the usual (23% instead of 10%).
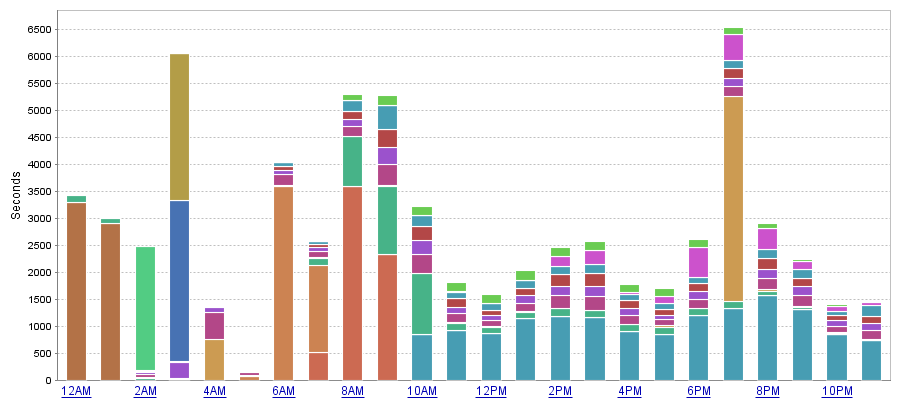
Below are two graphs from DPA. The graph on the left shows my system performance a few days prior. The graph on the right shows system performance the morning of the incident. Focus on the 8AM hour, and the scale of the graphs. What I deem to be “normal” system performance on the left shows an overall wait period of about 14,000 seconds at the 8AM hour. But on the right, the wait is over 50,000 seconds. You will also notice the vast majority of the wait time is coming from that pretty blue block. Also important to note is that this pretty blue block (which represents a query) is not present in the normal graph on the left, even though there is another color block that is very similar (trust me, it’s not the same query).
[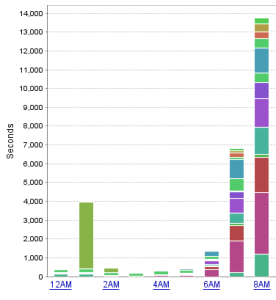 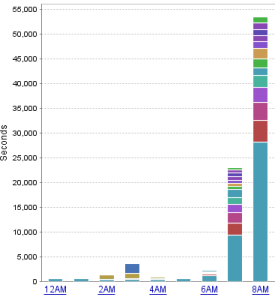](/images/abnormal_chart_dpa.png)
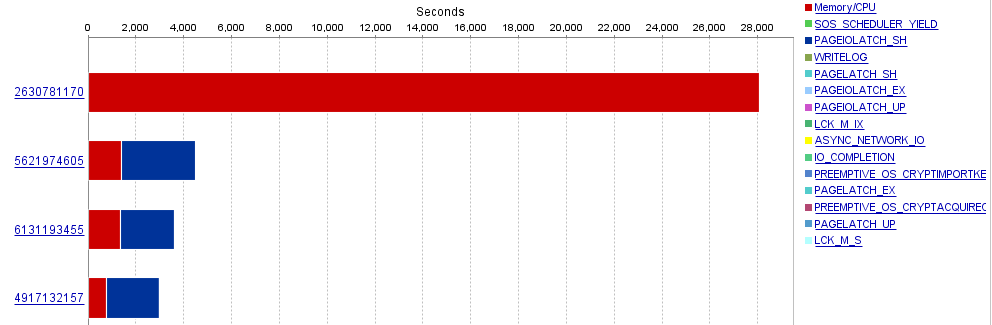
A mouse-over of the block shows the name and the specific part of the query that is responsible for the wait. I am also able to drill down into the hour and see what kind of wait times the top queries are experiencing. In this case, it turned out to be completely due to CPU/Memory consumption. You can also see that this query is using much more CPU than the other queries.
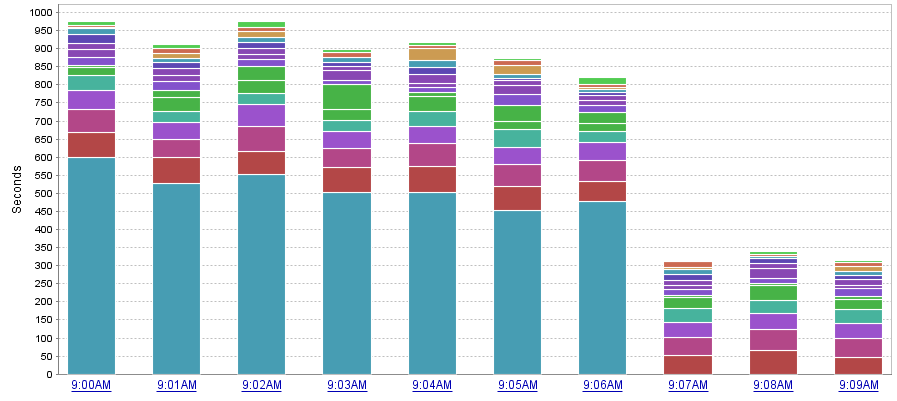
Looking back in time, I also wanted to verify my theory that this procedure probably started acting up after maintenance. This was confirmed by the graph from Sunday, which shows the pretty blue blocks popping up right after the update statistics jobs completed during the 9AM hour.
DPA is not necessarily saying that the query is waiting on the CPU, but also that the query is utilizing CPU time. So what I know at this point:
- This query/procedure is not normally on my graphs as a top resource utilizer
- The CPU is running hot
- This query/procedure is using a lot of CPU, more than the other individual queries.
- The issue began after maintenance completed, which indicates a possible bad execution plan.
What if I don’t use DPA?
Up until now, I’ve relied heavily on SolarWinds DPA to help me track down the query. It’s not the only way to do it. If I did not have access to DPA, I probably would have ran a duration trace to find anything over 1000ms or 1500ms and adjust from there. I did actually run a duration trace against the database looking for exec dbo.GetIDXIntegratedTaskList% to see if there were any patterns to be identified. Perhaps someone was executing the query with bad parameters, or a web server went haywire and is flooding the database with requests. In this case, I did not see anything unsual about the queries, other than the fact that the execution time was averaging 1.5 seconds and the matches were rolling in at a high rate. A more general duration trace would have also matched up a lot of this data and would have alerted me to an issue with the procedure.
In addition to duration traces, you can also use Activity monitor to find Recent Expensive Queries and sort by Executions/minute or CPU. This isn't always a sure-fire way to identify the issue, but it’s a good idea to at least try.
The last way I would attempt to find the query is by querying DMVs for query and procedure execution statistics. The problem here is that this information is cumulative since the system started. You can reset wait statistics, but you would have to clear out all of the procedure cache in order to reset the stats on the queries and procedures. In this case, the issue would have magically disappeared, but you would not know what the problem was if you were to blindly clear the cache.
Luckily, there is a creation_time column in sys.dm_exec_query_stats and a cached_time field in sys.dm_exec_procedure_stats. You could attempt to sort by these columns and filter down to cached plans that were created around the time the issue started. If you are able to identify which plans are new and also have a very high total_worker_time, you can narrow down potential candidates for high CPU utilization.
I actually used the sys.dm_exec_procedure_stats to confirm my other findings and I will cover some of that here now.
Continuing
At this point, I am pretty sure that I know what the problem is. The procedure got a new execution plan after updating statistics and it’s bad. But just for the sake of it, I still want to get more information from the procedure stats DMV.
There are only three basic SQL statements I will need to use at this point, since I know the procedure I want to address. The first statement will query the sys.dm_exec_procedure_stats DMV for all the information on the stored procedure. For the sake of space, I’ve limited the rows in the screenshot to what I think is most important.
SELECT * FROM sys.dm_exec_procedure_stats WHERE object_id = object_id('Works.dbo.GetIDXIntegratedTaskList')

We can see that there are two cached plans for this stored procedure. It’s quickly apparent that the first one in the list has been executed the most and has the most total_worker_time. So, I will grab the plan_handle for the first entry and then query the sys.dm_exec_query_stats DMV for more information on the queries within that plan.
SELECT * FROM sys.dm_exec_query_stats WHERE plan_handle = 0x0500120093AD350A4001F50A100000000000000000000000
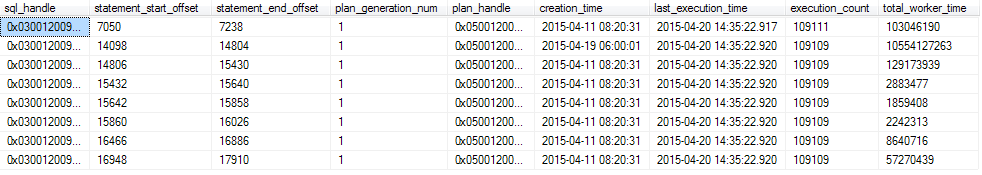
Now we can see that there are a number of queries being executed within this stored procedure. The statement offset start and end positions are specified. If you really wanted to look at the statement, you could use these offsets to help isolate that specific portion of the stored procedure. You also see the plan_generation_num. If this number is high, it indicates that the procedure or statement is being recompiled. The important data here is the creation_time, execution_count and the total_worker_time.
As we see, there are 8 SQL plans for this 1 procedure. The second row has the highest total_worker_time, meaning it is using more of the CPU than the rest of the procedure. We also see that the creation_time for this plan is different than the rest of the procedure. All the other plans in this procedure have been using the same execution plan since 04-11-2015. Our issue didn’t start until the 19th of April. We see that this coincides with the start of our problem and it’s using the most CPU out of the group.
From here you could check out the execution plan in depth, if desired, but I already know that it used to work better than it is working now. The decision I made was to clear the plan cache for this stored procedure and hope that the system would choose a better plan. To do that, simply grab the same plan handle and run:
DBCC FREEPROCCACHE (0x0500120093AD350A4001F50A100000000000000000000000);
(I originally tried to clear out only the SQL plan, but it purges the entire plan handle)
As soon as I cleared the procedure out of cache, the CPU utilization on my server dropped by 50% and my duration trace stopped displaying matches, since the query began to execute much more quickly.
I was also able to grab another screenshot from DPA showing the total wait time per minute. All of the CPU waits from this procedure disappeared once the new plan cache was calculated. I admit that there was a good chance that this would work, but it was not guaranteed. The system could have chosen the same plan again, or maybe even a worse one. But it all worked out for me… and for the users who were reporting slowness.